It is currently flu season, and many physicians across Canada are receiving shipments of influenza vaccinations at this time and administering them to their patients. In response to this, I created a temperature logging API for physicians’ vaccine refrigerators, called Vaxitemp. The temperature logging API can periodically get a temperature reading from a Raspberry Pi temperature probe, store it in a MariaDB database, and create a real-time plot of the temperatures. My temperature logger is currently being used by a few physicians and they’ve been finding it extremely useful.
I think Vaxitemp is something that is especially needed by physicians at the moment, given all the flu vaccines they’re receiving. There’s also the fact that we might be getting a COVID-19 vaccine soon, so it is crucial that those are also stored under the correct temperature conditions and monitored periodically.
Background
I was inspired to do this project by an incident that occurred in my household. A few weeks ago, one of my family members (won't say who) did not close the fridge door properly in our kitchen after taking some milk. The door did not close all the way, and this caused all of the milk inside to spoil. On the outside, it didn't appear there was any problem with the fridge; the door looked closed. However, the magnetic seal was not sufficiently tight enough, which exposed the inside of the fridge to room temperature, causing its contents to warm up and go bad.
Oddly enough, this home incident is not too different from what some physicians face when it comes to the refrigeration of vaccines. In these fields, similar vaccine fridge mishaps and malfunctions have occured, which have caused vaccines inside them to spoil. In both the physician's and my situation, a device that monitored the temperature of the fridges would have been very useful, to notify the user if the temperature was abnormal (whether it was due to a fridge malfunction, or just forgetting to close the door), thereby ensuring that no vaccine, or bag of milk, would need to go to waste.
For a variety of reasons, a lot of flu vaccines go to waste every year. In 2018, it was reported that the wastage of vaccines distributed by WDG Public Health was 4.7%, valued at $297,760.64.[1] WDG Public Health also mentioned that not all expired vaccines were returned to them, so the true vaccine wastage rate might be even higher. Flu vaccines are the most frequently wasted since there’s a new one each year, and according to Public Health, the demand for the vaccine is difficult for healthcare providers to accurately estimate.
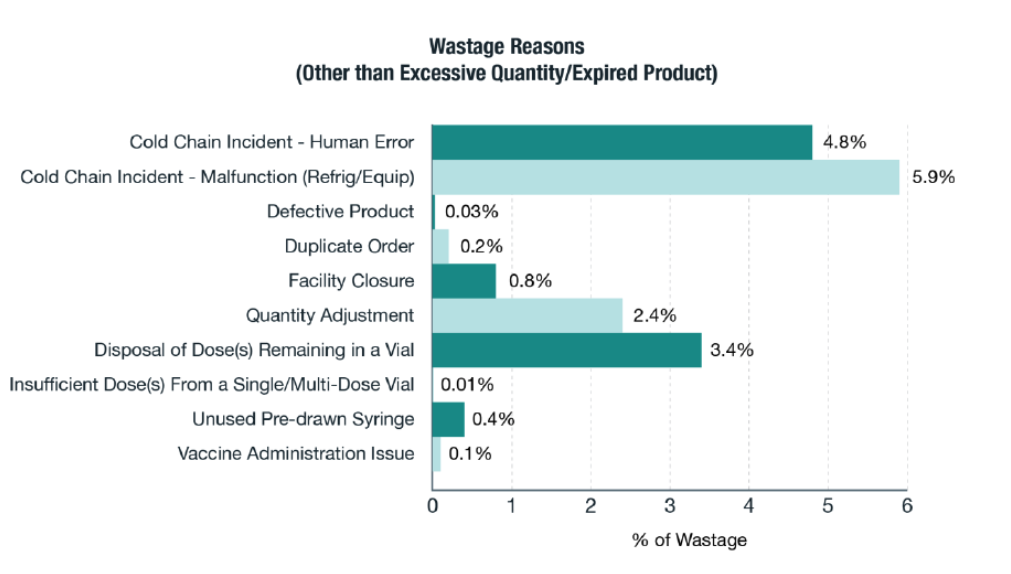 Graphic taken from BH.01.MAR0619.R07 - Vaccine Wastage for 2018 by WDG Public Health.
4.8% of the wastage was due to the vaccines not being within the required temperature range. Vaccines should be stored between 2°C to 8°C, and Public Health advies keeping the vaccines in this range, a practice known as “maintaining cold chain”.[1] 42 of these cold chain incidents were reported by community healthcare providers to Public Health’s Cold Chain team. Of the 42, 1 was caused by electricity disconnected due to human error, 5 were caused by leaving the refrigerator door open, 1 was due to an unmonitored refrigerator, and 10 were caused by other types of human error (unspecified on the report).[1]
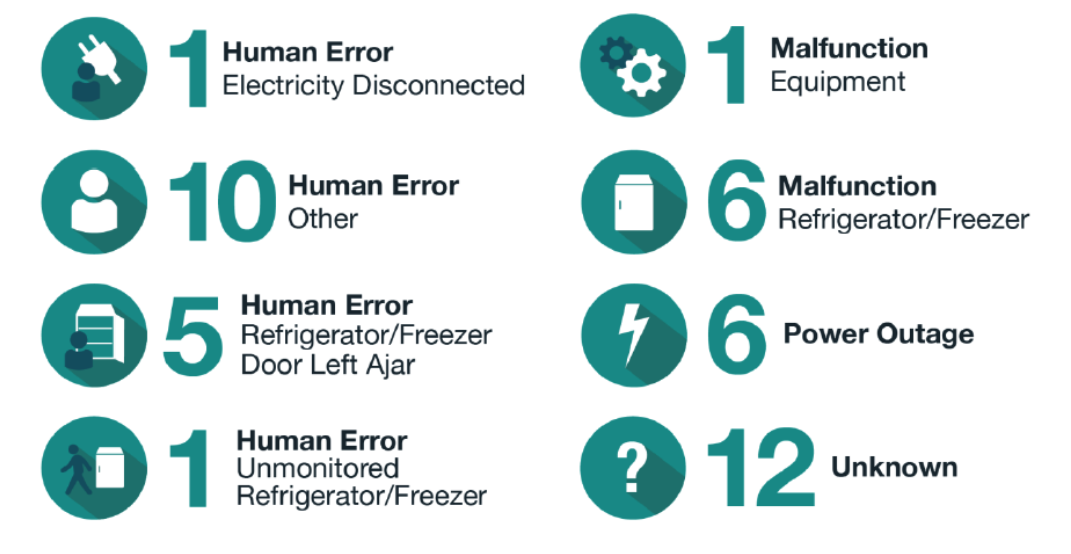 Graphic taken from BH.01.MAR0619.R07 - Vaccine Wastage for 2018 by WDG Public Health.
These incidents can be reduced if more physicians have access to an automatic temperature logger for their fridge, which would let them know on a constant basis whether or not their cold chain is being maintained. So you might see why I wanted to make this project. Regardless of whether the fridge was left open or the power was turned off inadvertently, physicians can look at the temperature logger for any abnormal temperatures and deduce that something is wrong (in the case of losing power on the temperature probe, they might also determine that something is wrong if the probe is not logging its temperature at the specified times).
The project
You can find the bash and Python scripts for Vaxitemp on my GitHub here.
I started by making a temperature probe using a Raspberry Pi 2 and a temperature sensor.
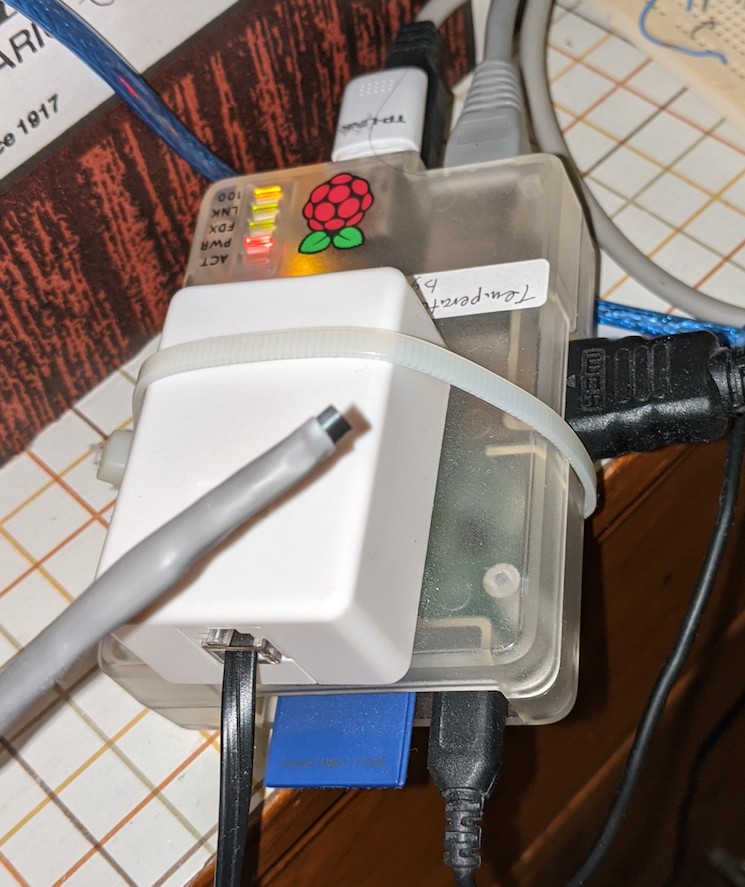 Raspberry Pi temperature probe.
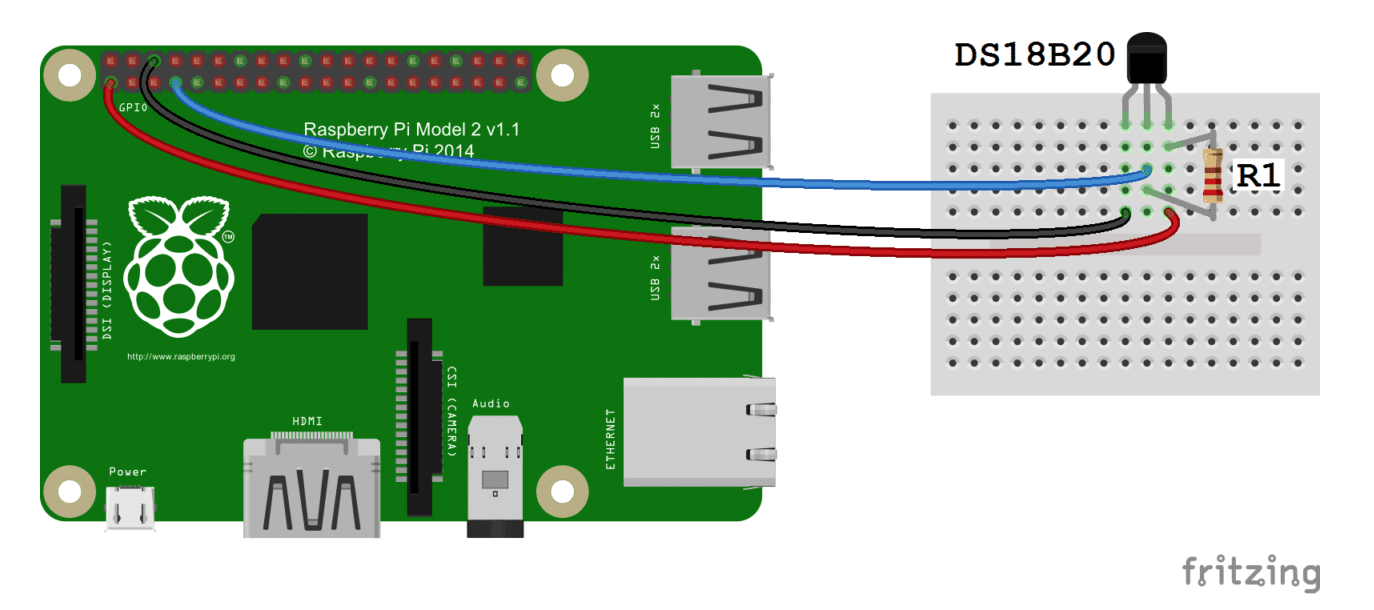 Schematic of temperature probe taken from Circuit Basics.
I then began setting up a mySQL database using MariaDB, hosted on a cloud server on DigitalOcean. This database would be storing not just one, but many physicians’ data, so I had to make a table with a list of users, each with a distinct user ID.
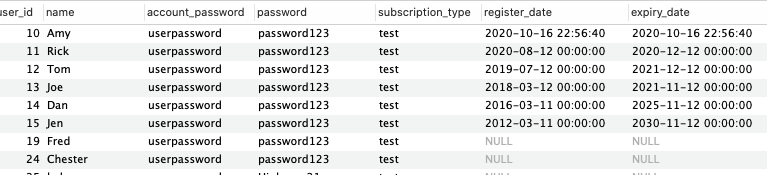 User table.
Each physician may have more than one refrigerator they would like to monitor, so I also made a table for the temperature probes, which were linked to certain users. As such, two probes may have the same user ID, but they’ve all got other distinguishable identifiable features such as their internal probe ID and their unique factory 96 bit probe ID number. This is also where the minimum and maximum temperature is stored. By default, all of them are configured to a min and max temperature of 2°C to 8°C, respectively (the “cold chain”), but I will add a feature for physicians to set these values to whatever they want for each of their probes. These values are here so that if a temperature reading is not within the range, the owner of the probe will get notified (a feature I will also add later).
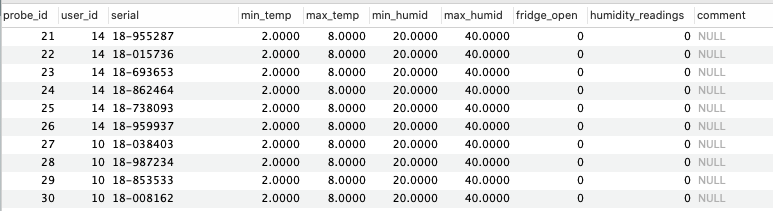 Temperature probe table.
Finally, I made a table for the temperatures. This is where all the temperature readings will be stored for every probe. The fields for this table are the temperature, log date, and the ID of the probe which the temperature came from. The table also uses the log date and probe IDs as indexes. This will make generating the temperature plots for a specific probe a lot quicker, as you will see later.
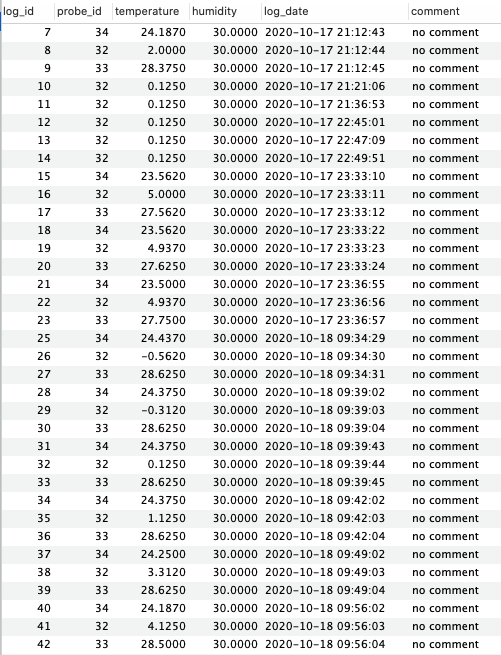 Temperature reading table.
Then, using the Flask library, I wrote a Python API script which could get requests from the Raspberry Pi probe. Among other things, the API can get POST requests from a probe to either register its serial number and user into the database (something that only needs to be done once from each Pi), or log its current temperature and date (which will be done multiple times periodically). The script accesses my database using the mysql.connector library.
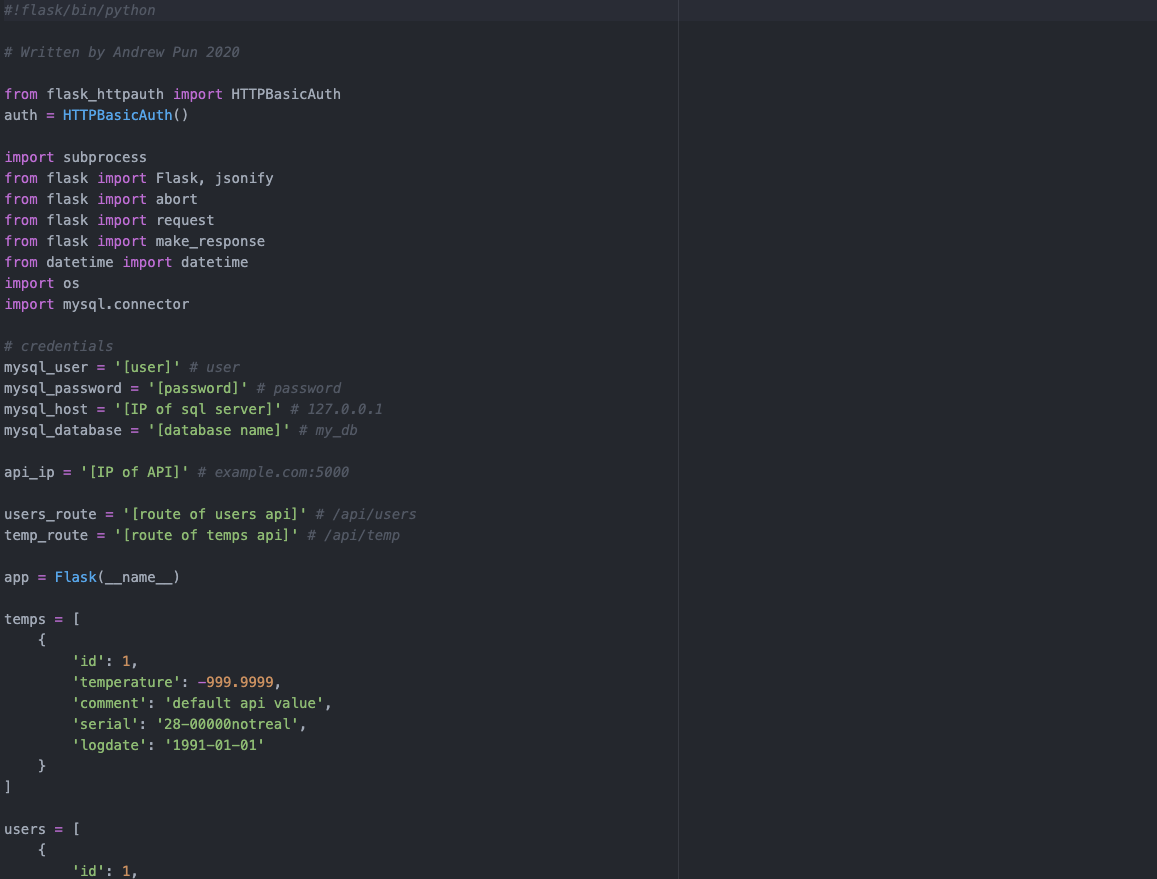 First Python script (can be found here).
I set up a few bash scripts in my Raspberry Pi script, both based on a script written by San Bergmans from SB-Projects.
His script loops through all attached temperature sensors on the Raspberry Pi and echos the temperature reading and serial number of each. I modified the script so that in addition to echoing this data to the terminal, I made it send the data to my server using the curl command. I added this script to the Pi’s crontab so that it would send a temperature reading to the API every 15 minutes.
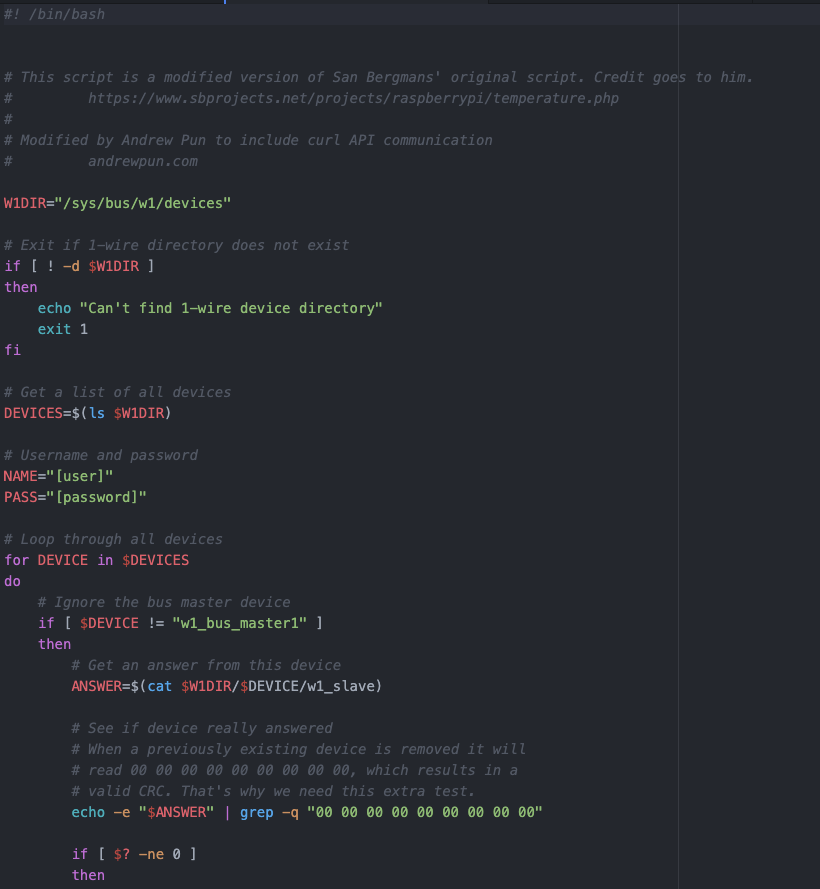 First bash script (can be found here).
I wrote a second bash script, again adapted from San Bergmans’ script, which loops through each temperature probe. However, this time, instead of sending temperature data, it just sends the serial number so that the API can register it in the database. This does not need to have a cron job because it only needs to be run once to be registered in my database. Odds are, many users who have set up a Raspberry Pi temperature logger are using the script from SB-Projects, so just by adding a few lines, they can modify the script so that it also sends the data to my API with the correct credentials.
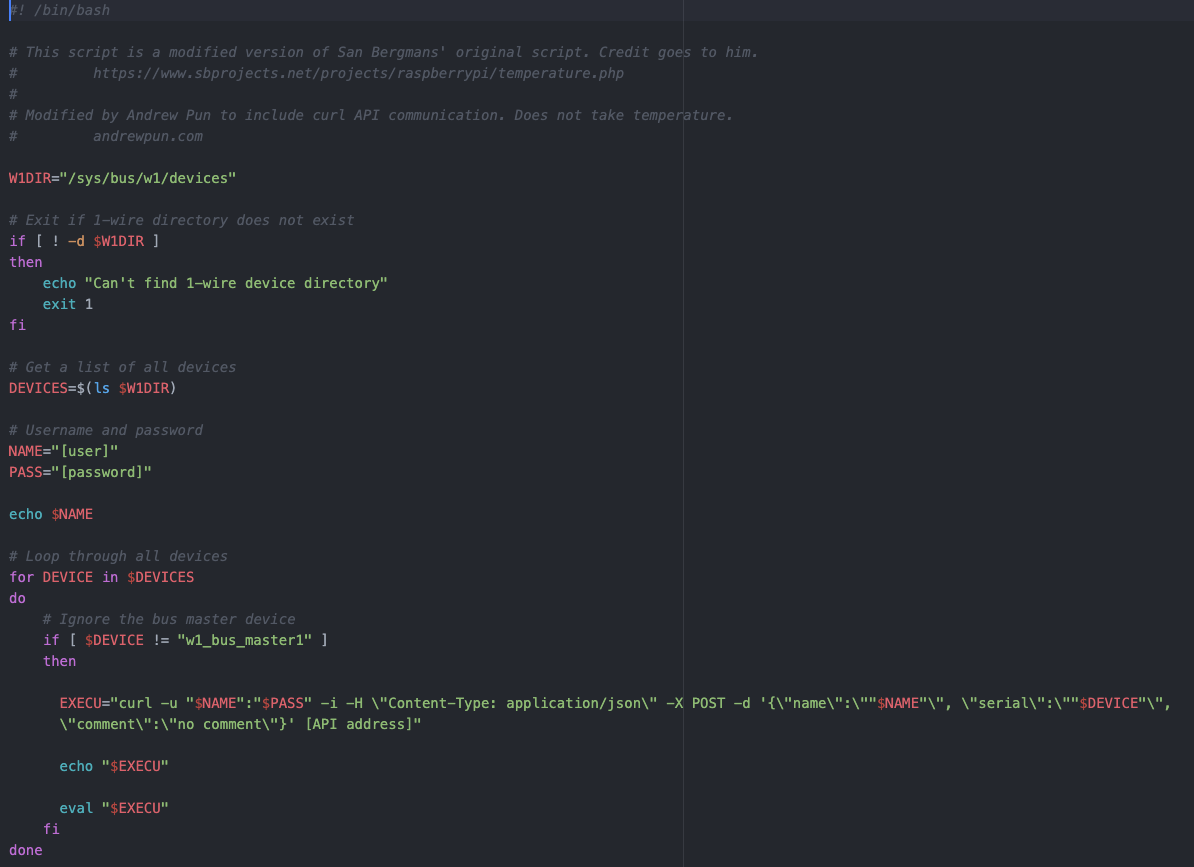 Second bash script (can be found here).
I also made the API script call another Python script which searches the temperature table on my database to get temperature and date values, in order to generate a temperature plot using the plot.ly library. This writes the graph to an .html file which can be accessed on a website. Every time a probe uploads its temperature to the API, the API calls this other Python script to update the temperature plot for that specific probe. I mentioned previously that on the temperatures table in my database, I used the log date as an index (descending, to be exact). This is because I’m only making the Python script select entries logged from the past 3 days. With this additional index, the log dates are sorted internally from latest to first, removing the need to do a lengthy, full table scan. I also added an index for the probe ID (which are integers) so that in this query, a full table scan is also not required to find entries of a specific probe ID.
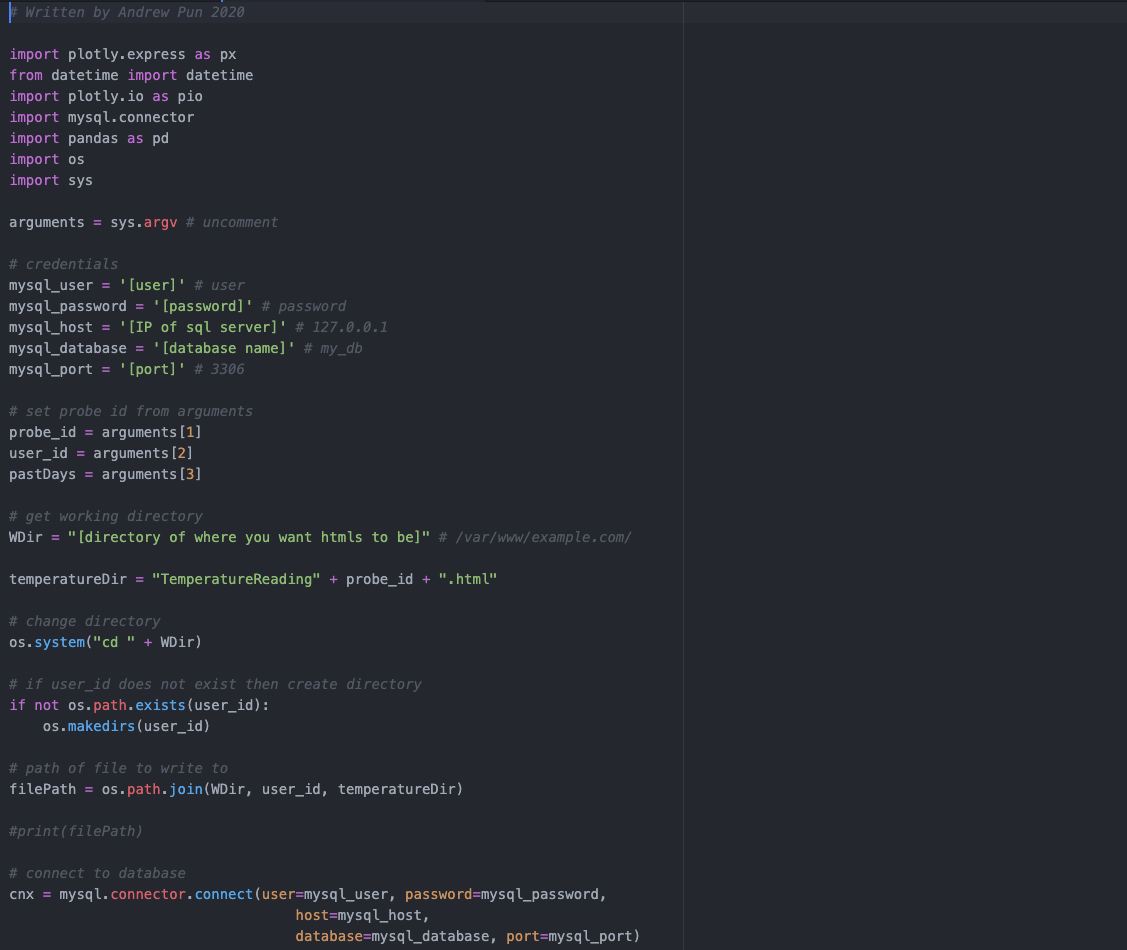 Second Python script (can be found here).
Additionally, this Python script takes the min and max temperature values stored from the probes table, and creates a green region in the graph that represents that range. Now, from the graph, physicians can see clearly if their temperatures are in range.
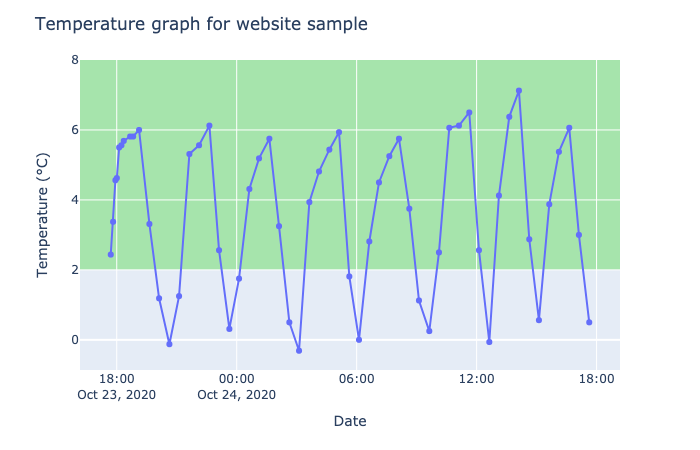 Sample temperature plot. Green indicates temperature range from 2°C to 8°C in this case.
Plot.ly’s graphs are extremely interactive. For example, with the graph, you can zoom in, zoom out, pan, and save the graph as a picture. Here’s an interactive sample temperature graph below. Try out its features!
Interactive temperature plot.In order to run the Python API script in the background without having to have a session open, I used the nohup command on the script.
nohup python ~/api/posttest.py
Conclusion
And that’s a majority of Vaxitemp done! It is currently logging the temperatures of 13 different probes without issue. So far, I’ve got a few physicians trying it out on their own fridges, and many more physicians who are willing to try it. I’d say this project is a success and is a great alternative to some of the more expensive temperature probes and online plotters made for physicians on the market right now. This is something that is especially needed with all these influenza vaccines being shipped to physicians, and is going to be extremely useful when the COVID-19 vaccines arrive.
There are, however, some more features I would like to add. In the future, as mentioned before, I would like to make an email client so that my clients will be notified if their temperatures are not maintaining “cold chain”. I tried using a dummy email and Google’s API script to send emails, to some success, however, it stopped working after a while, so I’m currently trying to get that working again. Additionally, I would also like to add a feature where each physician can download their data as a .csv file, or select different date ranges for the graph. Those are just a few quality of life improvements which would definitely be welcome.
Thanks for reading!